
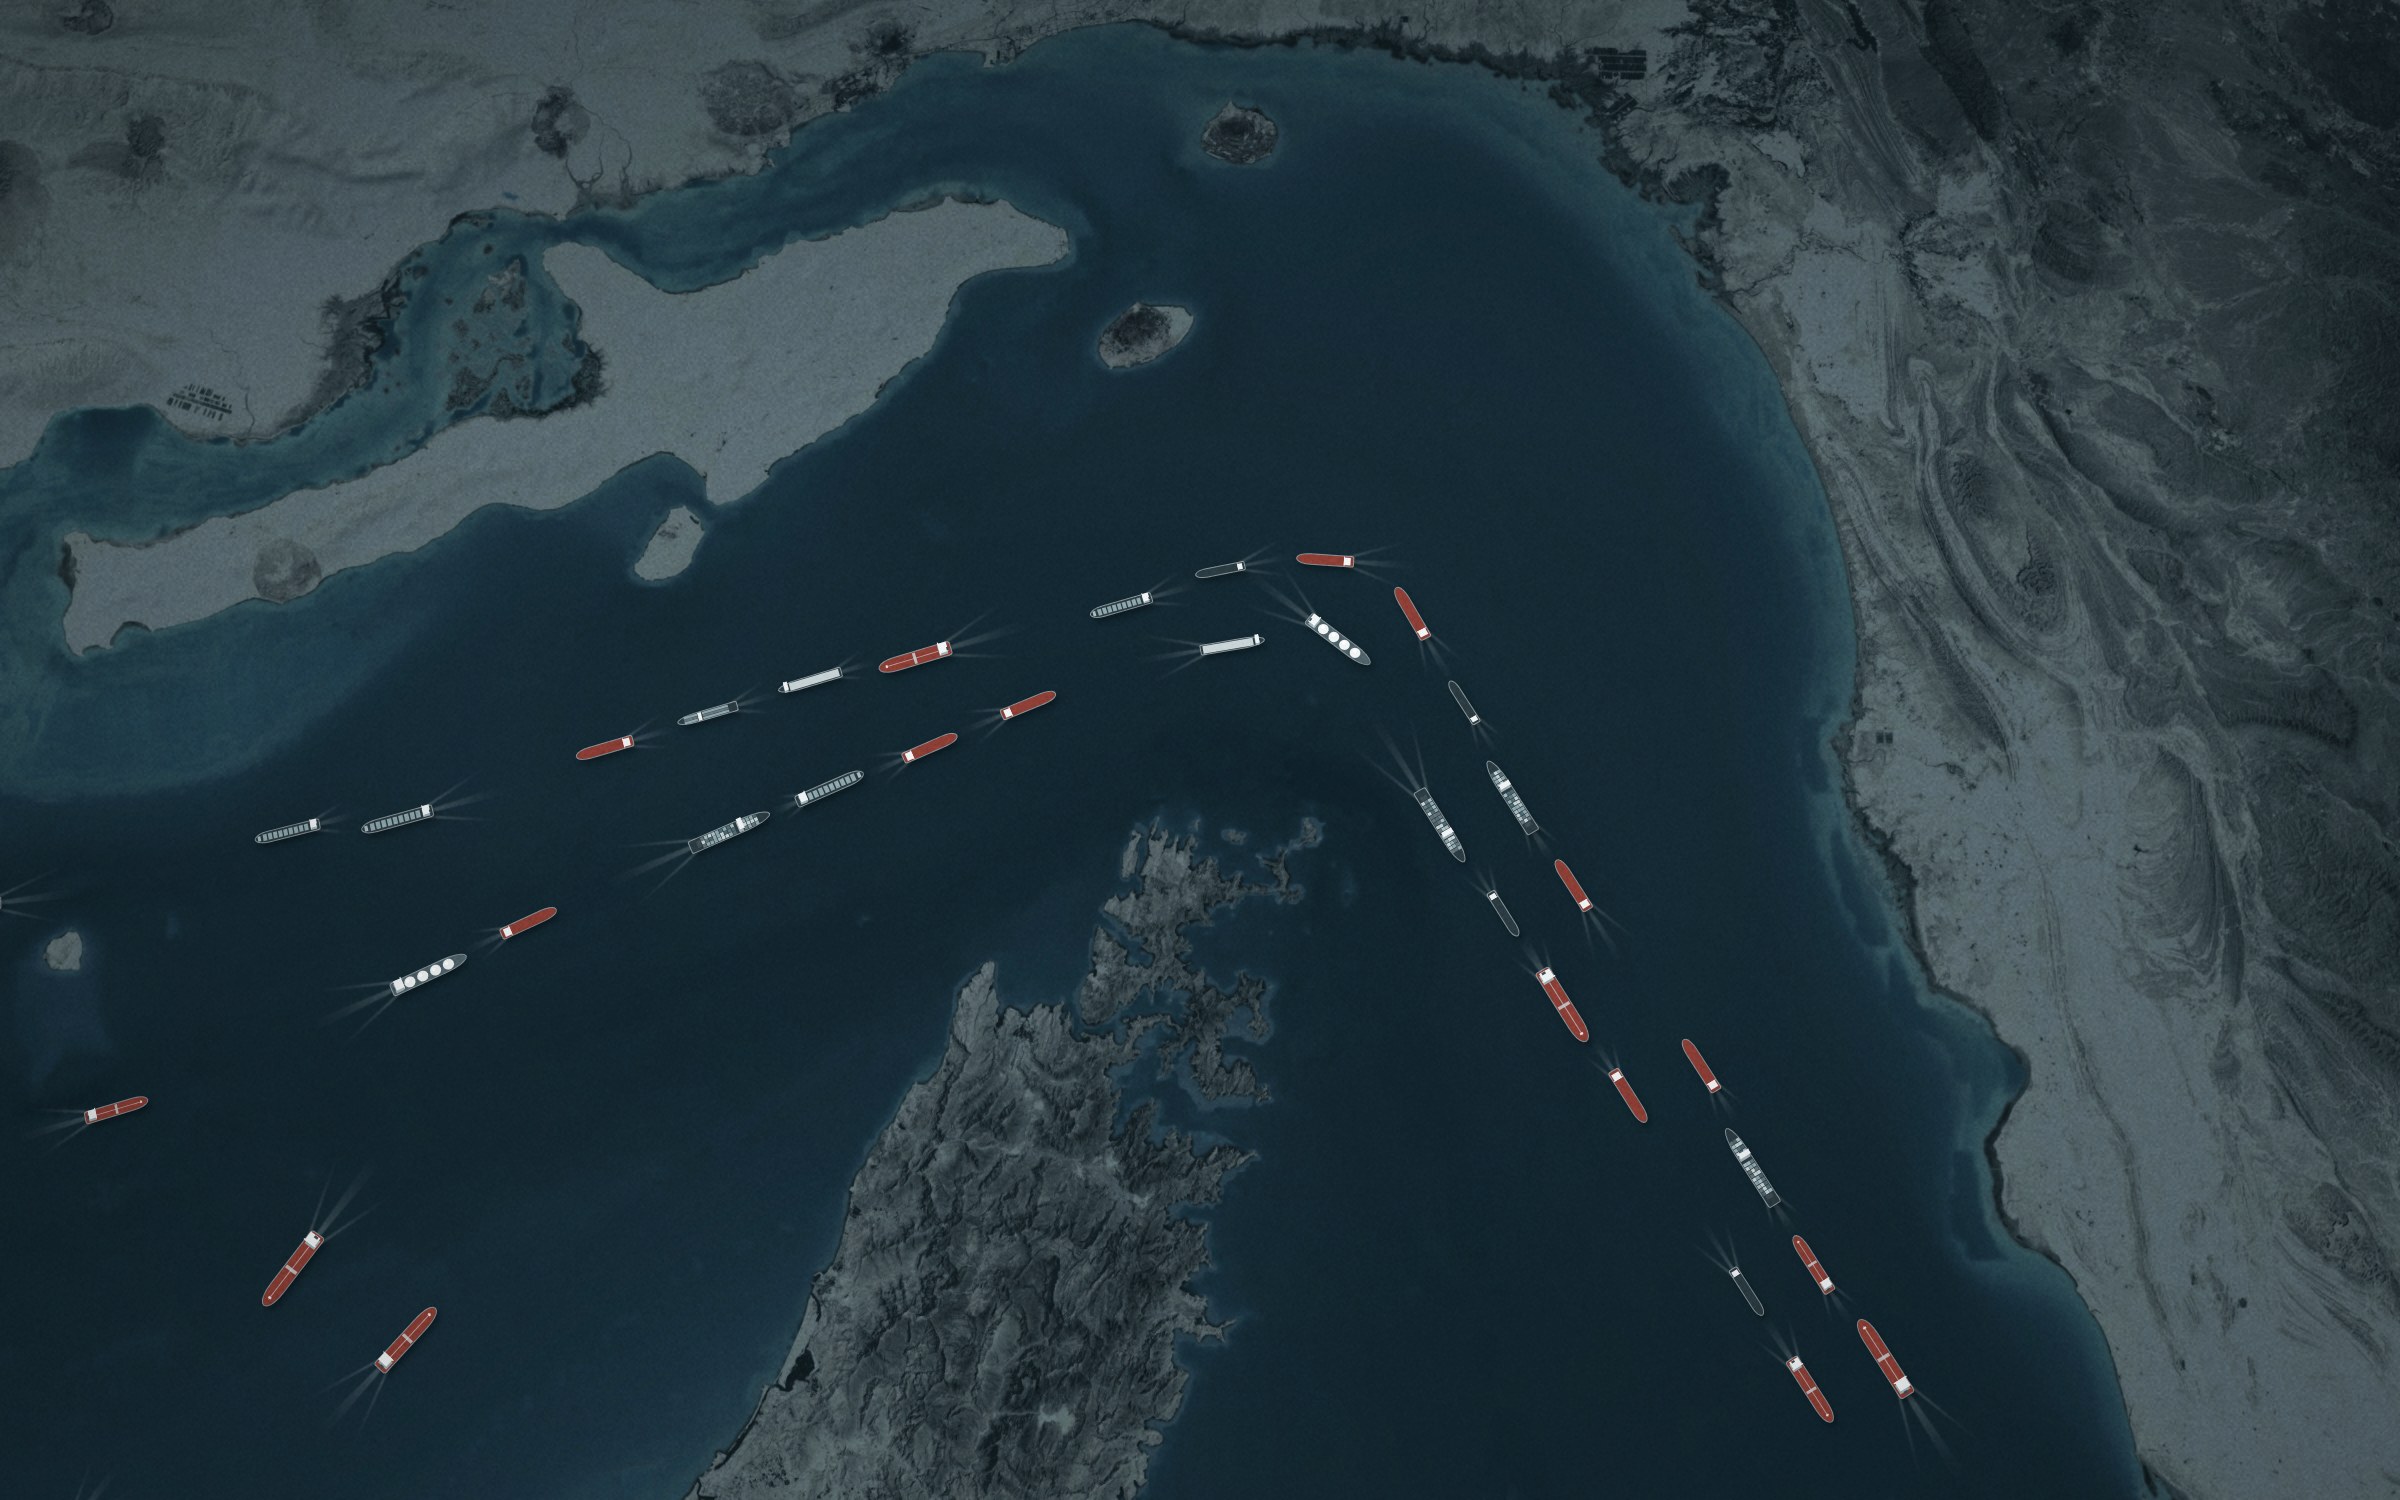
Since 1 March the Strait of Hormuz has almost disappeared from satellite AIS. IMF PortWatch, which counts transits from ship transponder signals, logged an average of 73 ships a day from September 2025 to February 2026, and 6.6 a day from March to September, a drop of 91%. On 27 September it counted one. Yet Vortexa's cargo data puts Saudi Gulf loadings back near 4 million barrels a day. Both can be true, and the gap between them is the most useful thing we learned this quarter.
What the AIS data shows
The collapse took two days. After a late-February rush of more than 100 transits a day, PortWatch counted 4 on 2 March. Tanker transits fell from 40 a day to 2.7, a drop of 93%. The only visible recovery came in late June and the first week of July, when transits briefly climbed back above 20 a day.

The loading ports inside the Gulf followed. Estimated tanker loadings at Basrah fell from about 10 Mt a month to under 1 Mt (March to July average). Ras Tanura went from 4.0 Mt to below 0.5, and Qatar's Ras Laffan LNG terminal from 4.7 Mt to 0.8, about 1 Mt a month since June.
The visible bypass routes moved the other way:
- Yanbu, Saudi Arabia's Red Sea terminal at the end of the East-West pipeline, loaded 19.8 Mt in June, more than five times its pre-war pace.
- Sidi Kerir, the Mediterranean end of Egypt's SUMED pipeline, peaked at 7.2 Mt in August against 1.9 Mt a month before the war.
- Fujairah, outside the strait and fed by the Habshan pipeline, fell to almost nothing in March and has recovered to 2.2 Mt in the first 25 days of September.
- Bab-el-Mandeb tanker transits rose to 15 a day in March as Saudi barrels went west, then fell to 8 a day by September.
- Cape of Good Hope tanker transits averaged 18% more from March to September than in the six months before, though September alone was only 6% higher.

What it misses
Two signals in our own data look like visibility problems, not changes in flow.
The first is Yanbu. PortWatch counted 7 tanker calls there on 22 July and none on 23 July. In the two months since, it has logged only six, never more than one a day, the last on 9 September. Ports do not stop overnight while their feeder pipeline is running. According to sources cited by Reuters, East-West pipeline flows to Yanbu ran near 4 million barrels a day until drone attacks shut the line in mid-September. Either most tankers loading there switched off their transponders, or the feed largely lost the port. Either way, a model built on AIS alone would show Saudi exports from Yanbu all but stopping in late July, which probably did not happen.
The second is Hormuz itself. Windward counted 55 AIS-visible transits in the week to 23 September, 94% below pre-war levels on its own count (PortWatch logged 26 that week), and says the true number is almost certainly higher. Vortexa's cargo data, which Windward says does not rely on AIS, puts Saudi Gulf crude loadings at 3.9 million barrels a day for 1 to 27 September: four times August, and 39% below January. Windward describes a tanker shuttle: run the strait with AIS off, transfer the cargo ship-to-ship in the Gulf of Oman, go back for more. On 1 October Bloomberg reported that congestion is pushing those transfers as far as India's Gulf of Kutch.
The oil didn't stop. The signal did.
Our data has one more detail that fits. The visible surge from 23 June to 8 July overlaps Windward's account of the last Saudi VLCCs leaving Ras Tanura and Juaymah with AIS on, between 1 and 10 July, though the surge's busiest days (51 and 46 transits on 24 and 25 June) came before that window. On our reading, early July was the last time the transponder picture and the cargo picture agreed. And at Sikka, in the Gulf of Kutch, AIS-estimated tanker loadings have more than doubled since February, from 0.9 Mt to about 2.2 Mt a month in July and August. We cannot separate refinery exports from transfers in this data, so treat that as a lead, not a finding.
Why it matters for tanker earnings
A barrel that crosses the strait with its transponder off, waits for a transfer and changes ships uses more ship-days than one that loads at Ras Tanura and sails to Ningbo. Vortexa says a ship-to-ship transfer from a fully laden VLCC now takes five to six days, and that few VLCC owners are willing to enter the Gulf at all. That friction takes ships out of the effective fleet as surely as scrapping does.
Rates show it. VLCC earnings on the Middle East Gulf to China route (TD3C) went from $287,000 a day on 6 July to $1.24 million on 28 September. Tanker shares are up between 8% and 60% since 27 February, and second-hand tankers sold in September went for an average 2.8% above their VesselsValue valuations (14 sales).

The futures market is far calmer than freight. On 30 September Brent for November delivery traded at $104 and for November 2027 at $80. If the shuttle ends, volumes should come back, but the friction behind today's rates would go with it. This data cannot tell us how much of today's spot rate tanker share prices already reflect.

What we are watching
- Yanbu in PortWatch. Marine Insight reported on 1 October that Saudi loadings at Yanbu have resumed. If regular tanker calls reappear in the data, the July blackout was transponders, not the port.
- The gap between AIS and cargo data in Hormuz. If owners switch their transponders back on, the visible count should jump before flows change much. A narrowing gap is the first sign that the friction is unwinding.
- Ship-to-ship hubs. Transfers in the Gulf of Oman and the Gulf of Kutch are where the extra ship-days are being spent.
How we built this
Chokepoint transits and port loadings come from IMF PortWatch, which derives them from satellite and terrestrial AIS. Loadings are estimates based on draught changes, and September port data runs to 25 September. Freight rates are the Baltic Exchange weekly tanker report as republished by Hellenic Shipping News; prices and the futures curve are from Yahoo Finance. Second-hand sale prices and valuations are from VesselsValue's weekly sales report as republished by Hellenic Shipping News. Windward, Vortexa, Reuters and Bloomberg figures are as reported by Hellenic Shipping News and gCaptain between 17 September and 1 October 2026. In the video, ship symbols are scaled to PortWatch 7-day transit averages at 13.5 knots. Routes, the split between ports and the tanker size classes are our assumptions, chosen to match PortWatch's capacity per transit. Reported transits and ship-to-ship transfers are drawn as static outlines and are not counted. Everything else is our own analysis in the msr. Terminal. msr. and its partners may hold positions in listed shipping companies.
This article is for information only and is not investment advice.
AI-assisted research · Checked and signed off by the msr. team
The msr. letter arrives monthly. Subscribe.